
Skip to content
Portfolio construction for advisors

Client portfolios, built on real math.

Four optimisation methods. Backtests checked for luck. A full set of risk metrics. One process, every client.

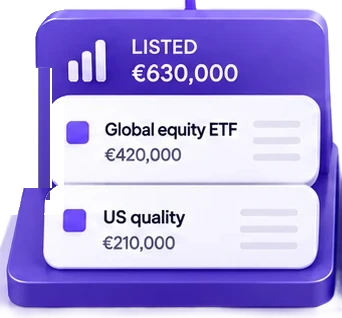
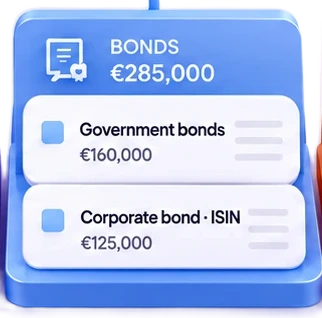
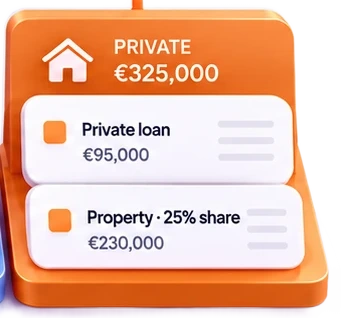
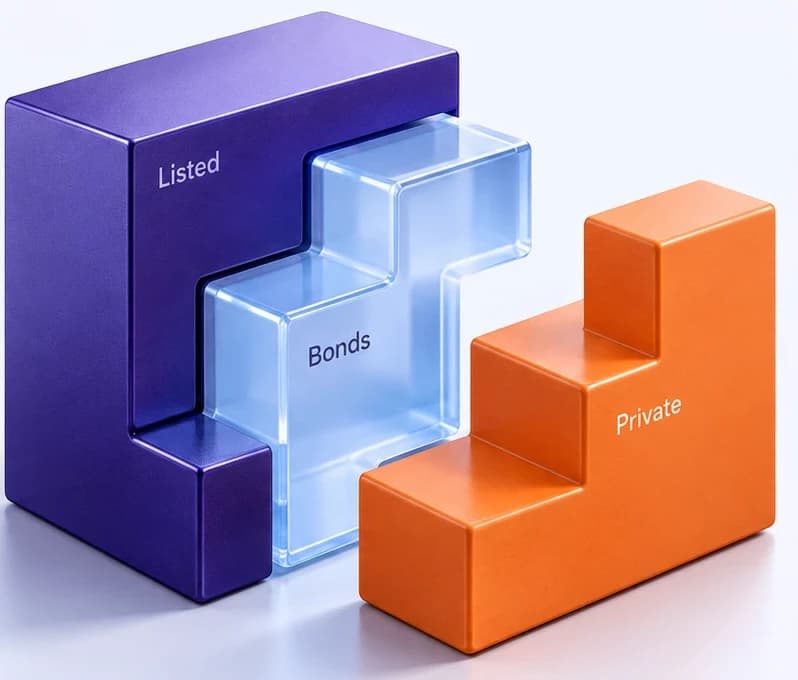
Three interlocking blocks labelled Listed, Bonds and Private forming one shape

Different assets. One portfolio.


Illustrative. Finki is a calculation tool, not investment advice.
The diversification illusion

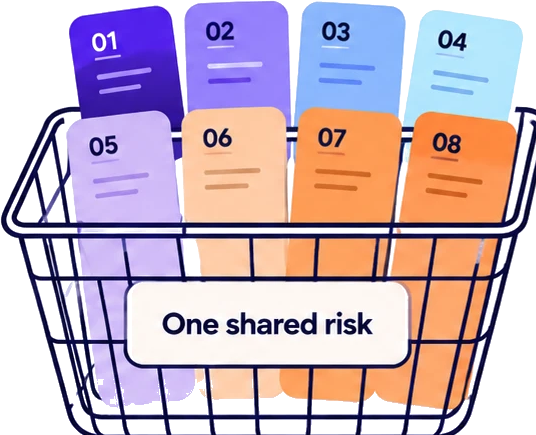
Eight holdings.
One bet.

Different names don't spread the risk when everything moves together.

Different holdings. Same basket.

01 · Construct

Allocation from how assets move. Not round numbers.

You set the constraints. Finki measures how your holdings move together and calculates the weights.

The assets are always yours.

  • Mean-VarianceBalance expected return and portfolio volatility.
  • Max SharpeFocus on expected return per unit of risk.
  • Risk BudgetAssign each holding a share of portfolio risk.
  • Min VarianceMinimise modelled portfolio variance.
  • Volatility target
  • Drawdown limit
  • Position caps
  • Sector caps
  • Tracking-error budget
02 · Test

Every strategy, backtested. Then checked for luck.

Twenty years of daily data, tested against your benchmark. Set rebalancing and dividends, then use bootstrap resampling to assess the result.

RebalancingQuarterlyDividendsReinvested
Through real market conditions
Your strategyBenchmark
20202022200620102015202020222026
Bootstrap checkSkill, or luck?
Observed Sharpe
0.94
95% confidence interval
0.41 – 1.47
p-value
0.03
Illustrative bootstrap result.

Illustrative. Past performance does not indicate future results.

03 · Analytics

Which holding is quietly carrying the risk?

Portfolio weight tells only half the story. See which holdings contribute most to the risk.

Move a holding. See the impact.

Where the risk sitsShare of moneyShare of risk
34%54%
17%29%
13%0%
10%4%
8%1%
19%13%
Global equity
34%of the money
54%of the risk
Illustrative risk contributionGlobal equity: 34% of the money. 54% of the risk.
Risk & downside
  • Volatility
  • VaR 95/99
  • CVaR
  • Max drawdown
  • Downside deviation
  • Skewness
Risk-adjusted returns
  • Sharpe
  • Sortino
  • Calmar
Portfolio relationships
  • Risk contribution
  • Alpha / Beta
  • Rolling correlation

Illustrative figures. Not investment advice.

04 · Aggregate

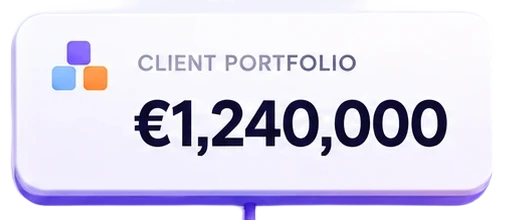
All of it runs on everything a client owns.

Brokers, bonds by ISIN, private loans, property. Imported, not retyped, so the maths above sees the whole book.

For advisors

Your process, documented.
Your edge, kept.

A consistent process.
A clear record.
The judgment stays yours.

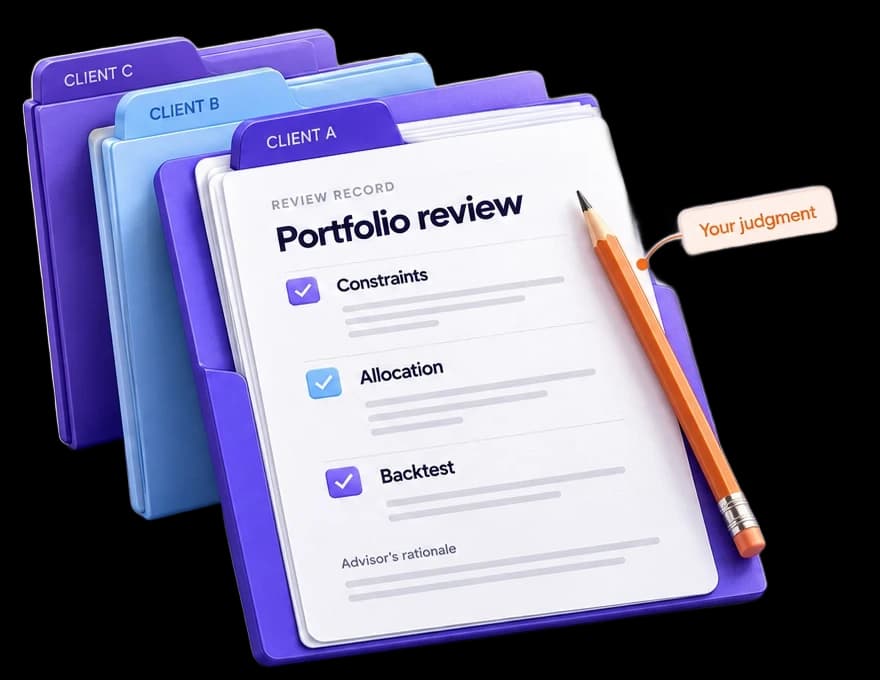
Three client folders; the front one holds a portfolio review record with constraints, allocation and backtest ticked, and the advisor's rationale written in pencil
More clients, same hours

One consistent process across every client portfolio you manage.

Decisions, documented

Constraints, allocation and backtests kept together in one record.

IPS · In development
Your ideas. Your decisions.

Finki evaluates the assets you ask about. It never suggests what to buy.

Security

Each client, isolated.

Row-level isolation on every client table✓
No client data in marketing or model training✓
Security questionnaire available on request✓
The people behind Finki

Built by an investor
and an engineer.

Two brothers. One shared purpose.

We combine investment experience with engineering to make rigorous portfolio construction practical.

Portrait of Paulius Beniušis, CFAThe investor

Paulius Beniušis, CFA

Investment & product

CFA charterholder with investment-management experience. Shapes Finki's investment logic and product.

Portrait of Matas BeniušisThe engineer

Matas Beniušis

AI systems & engineering

Builds Finki's platform, data pipelines and calculation engine. Turns the investment process into working software.

Investment experience. Engineering discipline. Shared ownership.

Twenty minutes. Bring a portfolio.

We walk through one of your clients’ books, live.